Market Minute: Bitcoin Pauses After Bullish Election Frenzy
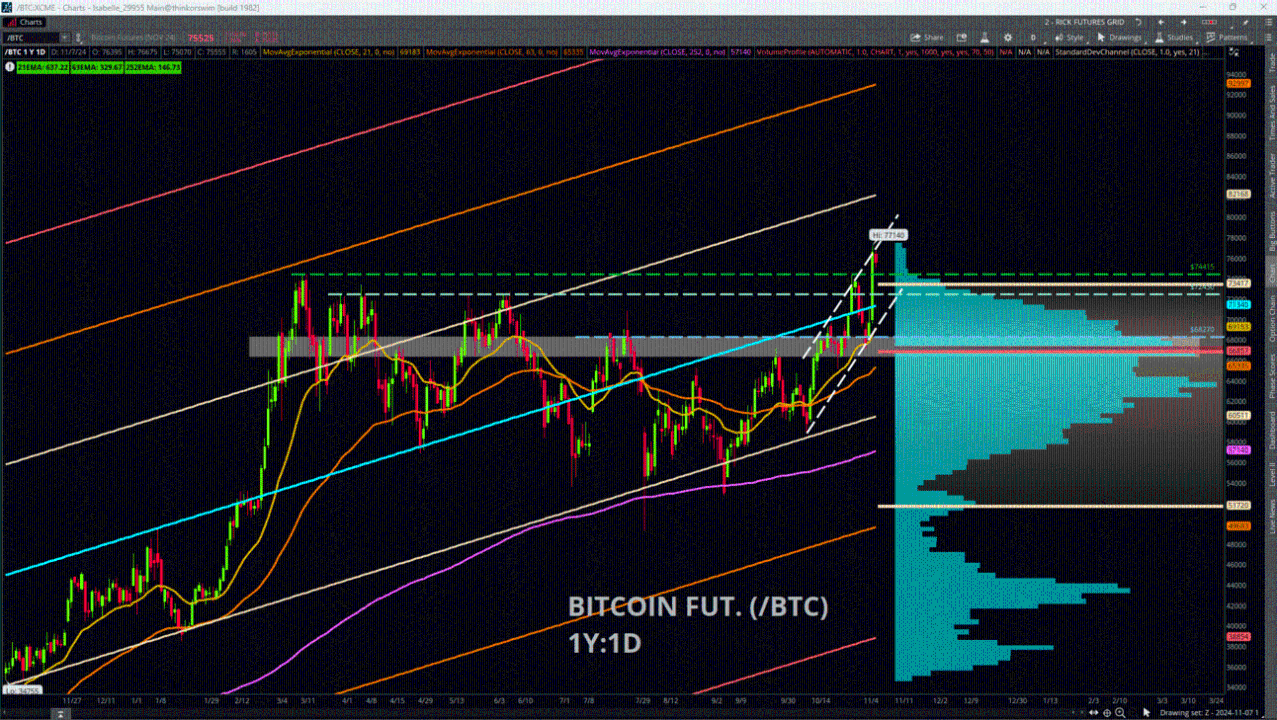
Crypto traders seem to feel bullish about Donald Trump winning the U.S. presidential election, as bitcoin futures (/BTC) surged about +10% yesterday and closed near the new all-time intraday high of 77,140. The contract is now taking a breather and is down about 1.7% from yesterday’s close. Many new traders may be attracted to these bullish charges to the upside that make big headlines, but consider the saga of bitcoin’s extraordinary volatility before you dive in. /BTC was at 4,210 in March, 2020, then rocketed to highs of 69,355 in Nov., 2021 (~+1,600% gain), then collapsed to lows of about 14,925 a year later in Nov., 2022 (~78% loss), and exploded again over the past two years to close at 75,295 yesterday (~+390% gain from Nov. 2022). These are incredibly unusual and extreme swings, so remember that volatility can cut both ways
Now, bitcoin bulls may feel like they have caught the tiger by the tail, as price is so far maintaining above the old resistance zone of about 72,450 to 74,425 based on previous highs during the past 52-weeks. How high can it go, and where does one look for potential resistance during breakout runaway highs? One way to think about this is to use yearly Standard Deviation Channels, which uses a Linear Regression Line (line of best fit) to create channels. These boundaries are based on standard deviations to the upside and the downside from this Linear Regression Line, essentially showing where relatively “extreme” price zones would be based on the product’s own price history.
Bitcoin had a huge breakout above this Linear Regression Line (around 71,340 as of yesterday’s close) on the back of yesterday’s news, which provides the +1 Standard Deviation Channel at about 82,168. Keep in mind, this is not a crystal ball that predicts where price will stop; rather, it gives a general area to consider as potential upside resistance. To the downside, watch for support at the previously mentioned zone between 74,415 and 72,450, then the yearly Linear Regression Line at 71,340.
Featured clips


Charles Schwab and all third parties mentioned are separate and unaffiliated, and are not responsible for one another's policies, services or opinions.


