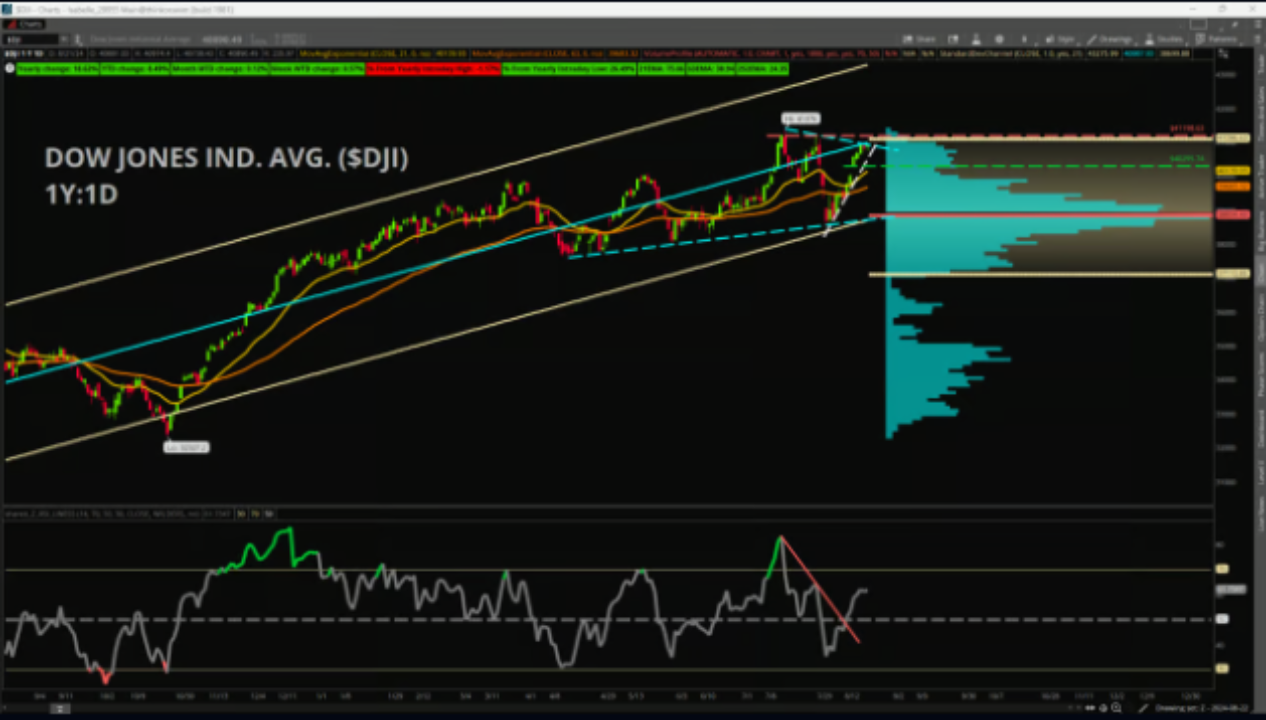
Market Minute: Dow Pushes to the Upside into Resistance
The Dow Jones Industrial Average ($DJI) has rallied about +6.4% since the lows on Aug. 5 as of yesterday’s close, sending the large-cap index back within a stone’s throw of the all-time highs at 41,376. The Aug. 5 lows near 38,499 were important because it meant that price held an upward trendline beginning in mid-April and connecting the subsequent lows from early May. Additionally, the early August lows also give traders the beginning of a shorter-term upward trendline to monitor.
The recent rally pushed above many commonly followed moving averages, including the 21-day and 63-day Exponential Moving Averages, as well as the 50-day Simple Moving Average. This is noteworthy because price closing above these technical indicators typically is regarded as bullish. Momentum also is on the move to the upside, as the Relative Strength Index (RSI) invalidated its own downward trendline that began with the peak that lines up with the all-time high close for price on Jul. 17, and then also quickly afterward broke above the 50-midline that separates bullish and bearish momentum. Additionally, the Moving Average Convergence Divergence (MACD) made its own bullish crossover on Aug. 15, lending greater credence to the bullish shift.
However, the all-time highs also provide traders with a couple of notable points that price needs to clear to continue the rally. First, there is a downward sloping trendline that begins with the intraday highs of 41,376, which is roughly where price closed yesterday. It also lines up closely with the yearly Linear Regression Line, a line of best fit based on closing prices, that comes in around 40,987. Beyond that, the all-time high close of 41,198.63 is about where price topped out a second time on Jul. 31, which gives us a double-top resistance area to watch as well. In terms of support, look for the short-term trendline which comes in near about 40,700, and then the post-gap up low point near 40,295.
Featured clips


People Willing to Upgrade iPhones "To Check Out this Thing Called A.I."
Market On Close
► Play video
Charles Schwab and all third parties mentioned are separate and unaffiliated, and are not responsible for one another's policies, services or opinions.


