Market Minute: Gold Breaks Out Above Trendline, but Stalls at Old Highs

When is a breakout not a breakout? Gold futures (/GC) traders must ponder this rather tricky question as the final trading day of the week dawns with some mixed signals from the yellow metal’s price action as equity futures rally out the gate ahead of a new incoming presidential administration on Monday.
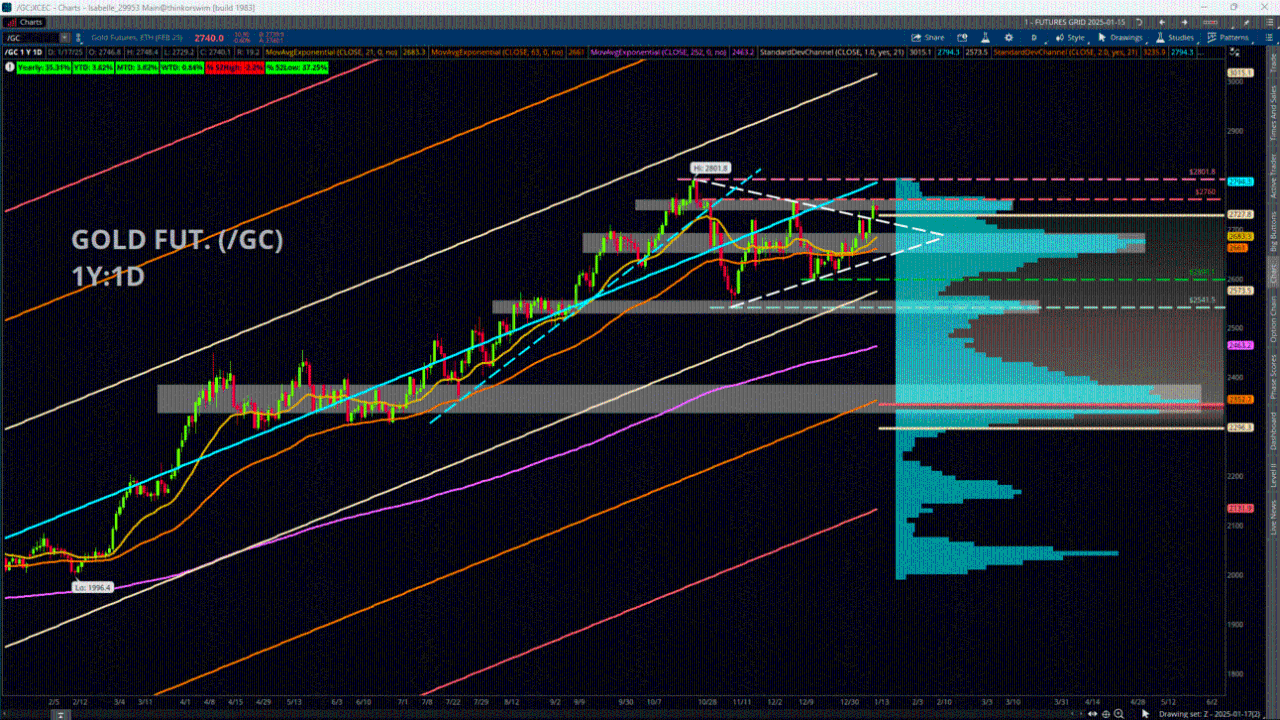
Gold has been on the move to the upside in recent weeks, with the /GC contract up about +5.8% from Dec. 18’s low of 2,598.10 as of yesterday’s close. The yellow metal now sits about -2% below its all-time highs of 2,801.80 in the premarket session. Yesterday’s +0.89% gain was notable because it pushed price above a shorter-term downward-sloping trendline that began with those same highs a little less than three months ago. An accompanying upward trendline beginning with the Nov. 14 lows presented an overall symmetrical triangle-type pattern, which is typically regarded as a sign of shrinking volatility as price compresses into an increasingly narrowing range.
Low volatility may seem rather boring, but it’s worth paying attention to because it can often be a precursor to high volatility when price eventually makes a push in one direction beyond these well-established boundaries – a potentially valuable piece of evidence that the overall trend could be shifting. Now, traders face a situation where, on one hand, price has broken about above the trendline; but, on the other hand, it then stopped cold at the previous highs from mid-December near about 2,760.
This level will be a key point to watch for whether /GC continues to rally. If price does break out above this level, the next area of interest is around 2,800. This is about where the old highs and the yearly Linear Regression Line (line of best fit) are clustered together, with the +1 Standard Deviation Channel currently suggesting that approximately 3,015 could be another area to monitor. To the downside, a retest of the old trendline could give potential support near about 2,718, while the 21-day Exponential Moving Average sits within a notable volume node (price level with heavy trading activity) near about 2,683.
Featured clips


Charles Schwab and all third parties mentioned are separate and unaffiliated, and are not responsible for one another's policies, services or opinions.

