Market Minute: Nasdaq’s Uptrend Shows Possible Interruption
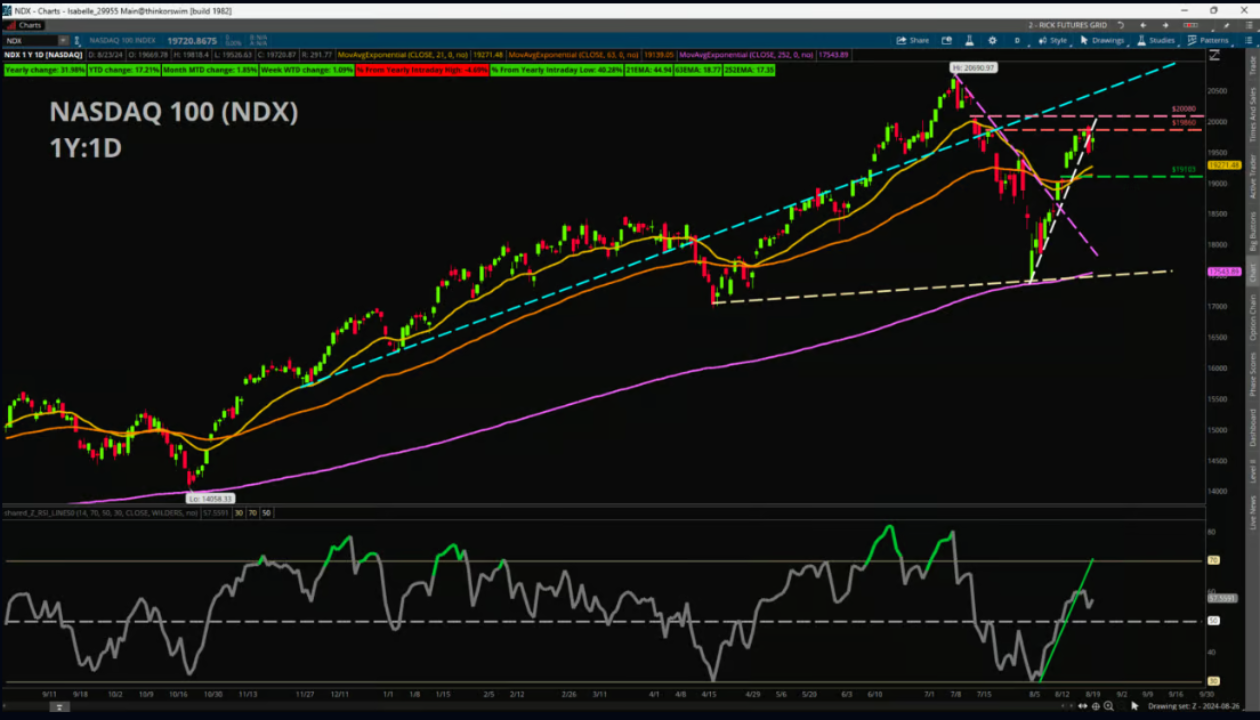
The Nasdaq-100 has enjoyed a notable rally this month, with the tech-heavy index up about +13% from the Aug. 5 lows to Friday’s close. This surge to the upside sharply reversed much of the losses sustained in the downswing off the all-time highs, which took price from about 20,690 all the way down to near 17,435, a roughly -15.7% decline in only 18 trading days.
However, the price action near the end of last week was not the most encouraging for the bulls. Price stalled out near a previous set of highs around 19,860, then formed a large bearish engulfing candle on Thursday. This means the real body (distance from the open to the close) of Thursday’s large red candle completely encompassed the real body of the previous day’s small green candle. But Friday did not see a continuation of the downward move; rather, it formed a harami candle, which is the opposite of an engulfing candle and occurs when the real body of the candle completely fits within the previous day’s real body.
In addition to the mixed picture from the recent candle shapes, the previously mentioned bearish engulfing candle on Aug. 22 resulted in price breaking through a shorter-term upward trendline beginning with the Aug. 5 lows. This downside break is mirrored in the Relative Strength Index (RSI), a technical indicator that measures momentum. The RSI shows a similar uptrend being broken on the same day, so this could be an early warning sign for potential trend change.
For support, one area that stands out is the confluence of the 63-day Exponential Moving Average with the pre-gap up high point on Aug. 14, which are near 19,139 and 19,103, respectively. For resistance, look to the recent highs near 19,860 and then the post-gap down high point of 20,080.
Featured clips


Charles Schwab and all third parties mentioned are separate and unaffiliated, and are not responsible for one another's policies, services or opinions.


