Market Minute: Russell 2000 On The Verge Of A Breakout

The Russell 2000 (RUT) is often the odd man out relative to its peers among the major equity indexes in terms of price action. But the small-caps appear poised to follow the S&P 500 (SPX) and the Dow ($DJI) into new yearly highs, leaving the Nasdaq-100 (NDX) as the only laggard in this regard. To be fair, the SPX and $DJI made not just 52-week highs but all-time highs this week, whereas the RUT is still far short of that spike into its all-time own high of 2,458.86 that occurred in November 2021. The Russell 2000 futures contract (/RTY) is also showing a slight decline in premarket trading leading into a slew of economic data on tap today.
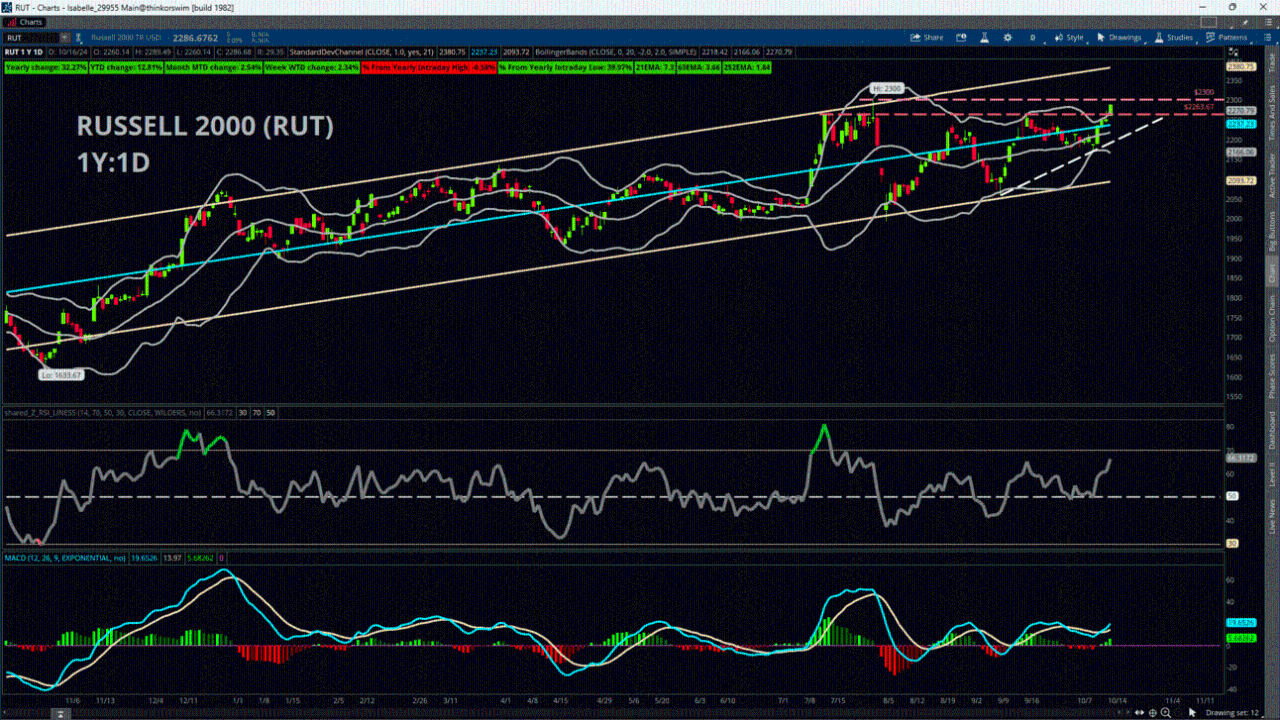
Nevertheless, the RUT has exhibited some vigor heading into the conclusion of this trading week. Yesterday’s +1.63% gain pushed price above a repeated ceiling of resistance roughly around 2,260 from July, and the candle closed near the highs. This means the small-cap index needs only about a +0.6% move to break above that high of 2,300, and there are few signs the trend is slowing down. Price remains comfortably above major moving average, even very short-term indicators such as the 9-day Exponential Moving Average.
Several other signs of strength have recently developed. The RUT closed above its yearly Linear Regression Line (line of best fit based on closing prices) on Monday, which was around 2,233 at the time. Monday also brought a bullish crossover on the Moving Average Convergence Divergence (MACD), which measures momentum. Another commonly followed momentum indicator, the Relative Strength Index (RSI), also continues to make new relative highs along with price.
Additionally, the Average Directional Index (ADX), which measures trend strength, has started to rise from a trough, which could suggest that the upswing is growing in intensity. However, this indicator is still showing a relatively low reading, so watch for it to cross above the 25 mark. The index also closed above its upper Bollinger Band yesterday, which is another bullish sign. Bollinger Bands give a representation of volatility by creating bands based on two standard deviations away from a 20-day Simple Moving Average, and a close above this band is a sign of a relatively extreme move in the short term and typically is interpreted as a sign of higher prices to come.
If price continues to push upward, the obvious next resistance area is the 52-week highs at 2,300. Beyond that, the yearly +1 Standard Deviation Channel (which is one standard deviation to the upside from the previously mentioned Linear Regression Line) could also be a potential source of resistance near 2,380. To the downside, the old resistance ceiling from July near 2,263 could be supportive, as well as the yearly Linear Regression Line near 2,237.
Featured clips


Charles Schwab and all third parties mentioned are separate and unaffiliated, and are not responsible for one another's policies, services or opinions.

