Market Minute: S&P 500 On Pace For Worst Week Since April
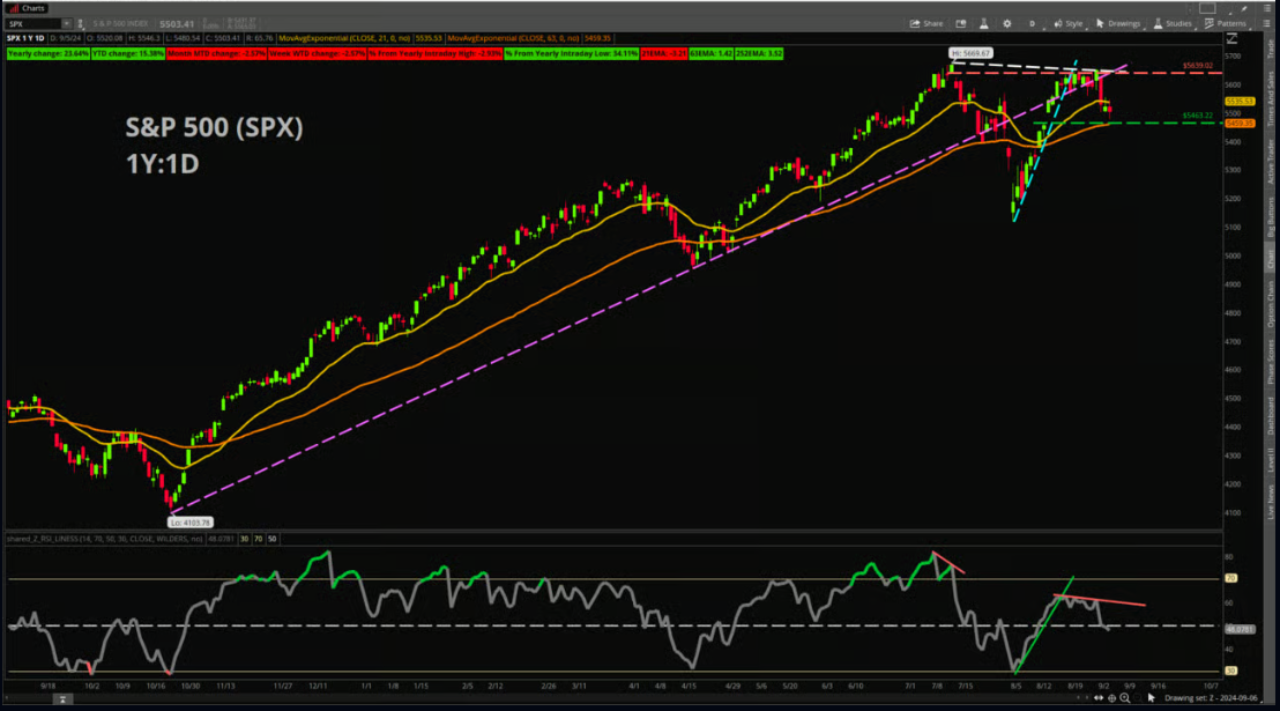
The S&P 500 (SPX) is down about -2.57% for the week as of yesterday’s close, which puts the index on pace for its worst week since April. Meanwhile, equity index futures, including the /ES, are pointing toward further weakness to come today as this shortened trading week winds down.
Bulls find themselves in something of a predicament with the recent price action, even though the SPX managed to fill a small gap near 5,639 from between July 16 & July 17. This was the same time when price peaked and formed all-time highs for the index, but the bulls were unable to make a convincing push above this key level and failed to break the previous highs. Now, price has failed to retake the 21-day Exponential Moving Average during the past two trading sessions and yesterday closed below the 50-day Simple Moving Average, presenting an early warning sign for potential trend rollover. Remember though: the shorter the term of the moving average, the more prone it is to false signals.
There are other alarm bells starting to ring for a potential shift to a broader downtrend. In addition to price now forming a downward trendline beginning with the all-time highs, price also has broken through two trendlines. The first begins with the yearly lows from late October near 4,103 and connects the subsequent lows. This trendline also experienced a major breakdown during the lows from early August, but it recaptured the trendline before once again breaking to the downside. The other shorter-term upward trendline began with the previously mentioned early August lows and was broken on Aug. 22 as price faltered near the old highs.
Momentum also shows some more bearish signs. The Relative Strength Index (RSI) showed bearish divergence as price recently struggled to break above the gap level near 5,639. Price made slightly higher closes, but RSI was trending down – a mismatch that can spell trouble for a trend as it suggests the pace of the gains is slowing. Price did indeed break lower, but it remains to be seen if it is the start of a more serious and longer-lasting trend. Additionally, RSI also closed below its 50-midline yesterday, which is another bearish signal. Technical traders also may have noted the Moving Average Convergence Divergence (MACD) indicator made a bearish crossover on Tuesday.
If price keeps moving lower, there is a nearby support confluence to watch. Look to the area near about 5,460, as this is the site of both the 63-day Exponential Moving Average and another gap from between Aug. 14 and Aug. 15. Beyond that, there’s another gap to watch to the downside near 5,377 between Aug. 12 and Aug. 13. To the upside, the 21-day EMA presents potential short-term resistance near 5,535, and then the previous highs near 5,650 are the mark to beat.
Featured clips


TSLA Accelerates Full Self-Driving Plans, NIO, AI & HPE Report Earnings
Morning Trade Live
► Play video
Charles Schwab and all third parties mentioned are separate and unaffiliated, and are not responsible for one another's policies, services or opinions.


