Market Minute: S&P 500 Slips, But Holding Above Old Highs

S&P 500 (SPX) bulls have faced a rather disappointing trading week, as the index backed off from its all-time highs and retreated to its old highs around the area of 5,670 from mid-July. Price made a major recovery after a sharp drop at the beginning of the day but rallied back into the close. However, S&P 500 Futures (/ES) faltered in the overnight session and fell almost to yesterday’s low point. All of this may have felt painful for bullish traders, but for perspective the SPX is down only about -1% from the all-time highs as of yesterday’s close.
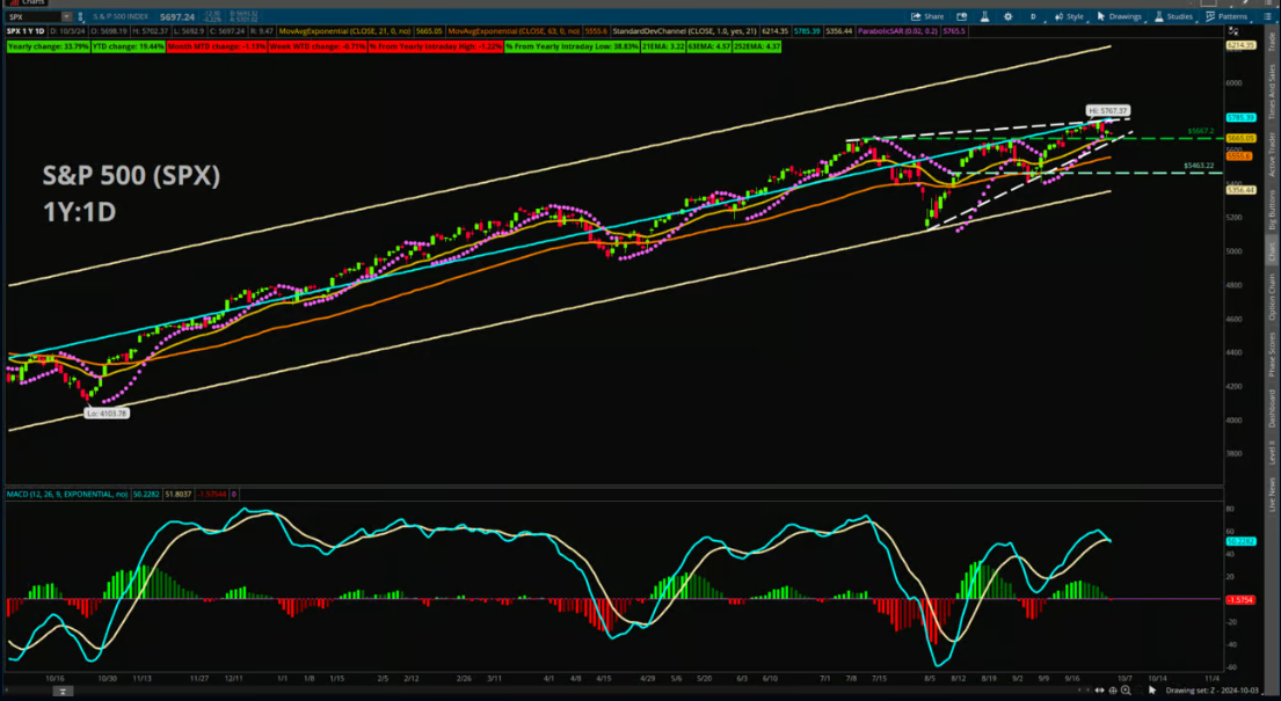
For the most part, technical reads are holding up. An upward trendline beginning with the Aug. 5 lows is still in play and price is hanging on above the previously mentioned old highs. Price also remains above most major moving averages, which are trending up. Yesterday’s swoon took price close to the 21-day Exponential Moving Average, which came in near 5,661, but quickly recovered without actually touching this potential source of support. Price did dip below very short-term moving averages, such as the 9-day Simple and Exponential Moving Averages; but traders must remember that the shorter the time period examined, the more prone the moving average is to fake-outs and fluctuations.
However, there are some bearish readings bubbling to the surface. For one, the Moving Average Convergence Divergence (MACD) indicator, which measures momentum, made a bearish crossover yesterday. Another is that the ParabolicSAR, which helps traders choose stop loss prices and assess trend direction, also made a bearish crossover yesterday. Both of these are possible early warning signs of trend change.
If price breaks downward, watch the 21-EMA for support. Beyond that, look to the trendline beginning on Aug. 5, which would come in around 5,645. To the upside, if price manages to reassert itself and attempts to push above those recent all-time highs, there is also another source of resistance in the yearly Linear Regression Line. This is a line of best fit based on closing prices and is often used to project an idea of “fair value” of a financial product. This reading comes in at about 5,785, so look for potential slowdown there.
Featured clips


Charles Schwab and all third parties mentioned are separate and unaffiliated, and are not responsible for one another's policies, services or opinions.

