Market Minute: S&P Futures Take a Breather After New Highs

S&P 500 futures (/ES) logged fresh all-time highs yesterday, topping out at 5,8746.50 heading into today’s key economic data. But the Consumer Price Index and Jobless Claims reports resulted in equity index futures moving modestly lower in the premarket after yesterday’s +0.65% gain. Meanwhile, traders are gearing up for the beginning of a new earnings season with big financial institutions like JPMorgan Chase (JPM) and Wells Fargo (WFC) kicking things off in tomorrow’s premarket.
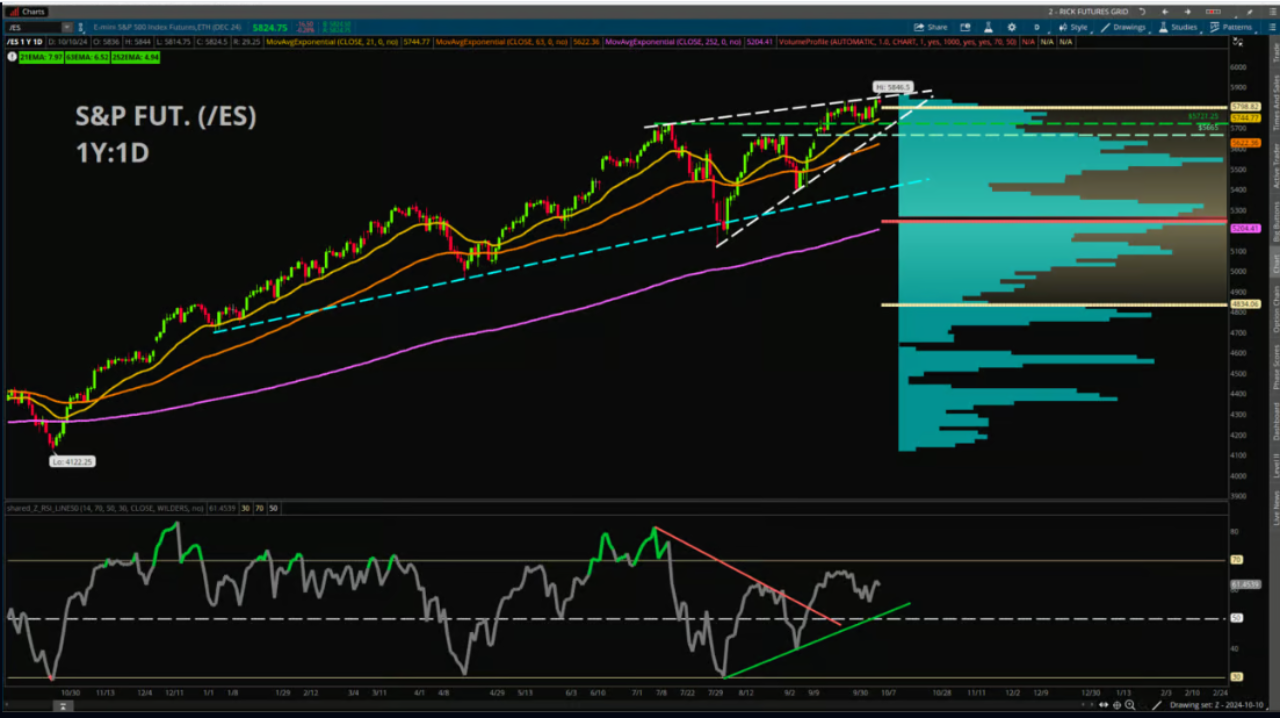
Even after this data sent markets downward, the technical picture shows few signs of trend rollover. Price remains comfortably above major moving averages, even very short-term ones such as the 9-day Exponential Moving Average. Be on the lookout for price to start closing below commonly followed moving averages, such as the 21-day EMA or the 50-day Simple Moving Averages, for signs of trend deterioration.
Momentum is the area where the bears could be gaining some ground. Technicians may have noticed the Moving Average Convergence Divergence (MACD) indicator recently logged a bearish crossover. This signals that the pace of the gains in price are slowing down. The Relative Strength Index (RSI) also is not exactly what the bulls would want to see, as it exhibits some bearish divergence from price. This means that price is making high closing levels but RSI is failing to surpass its previous peak, and suggests a mismatch between price action and momentum. Another indicator known as the Average Directional Index (ADX), which measures the strength of the trend, shows relatively low readings for directionality. Look for the ADX, which is currently around 23.80, to cross above the 25 level in tandem with a stronger directional move for clues about overall trend.
For now, the /ES finds itself close to one important potential resistance point: the yearly Linear Regression Line. This is a “line of best fit” that is often used to assess a notion of fair value for a financial product, and it currently comes in near 5,845. Watch to see if price can take out this important level, and then ultimately the previous highs. To the downside, look first for the 21-day EMA near 5,744, and then the recent lows which line up with the previous highs from July around 5,720.
Featured clips


Charles Schwab and all third parties mentioned are separate and unaffiliated, and are not responsible for one another's policies, services or opinions.

