Market Minute: SPX Continues Grinding Higher
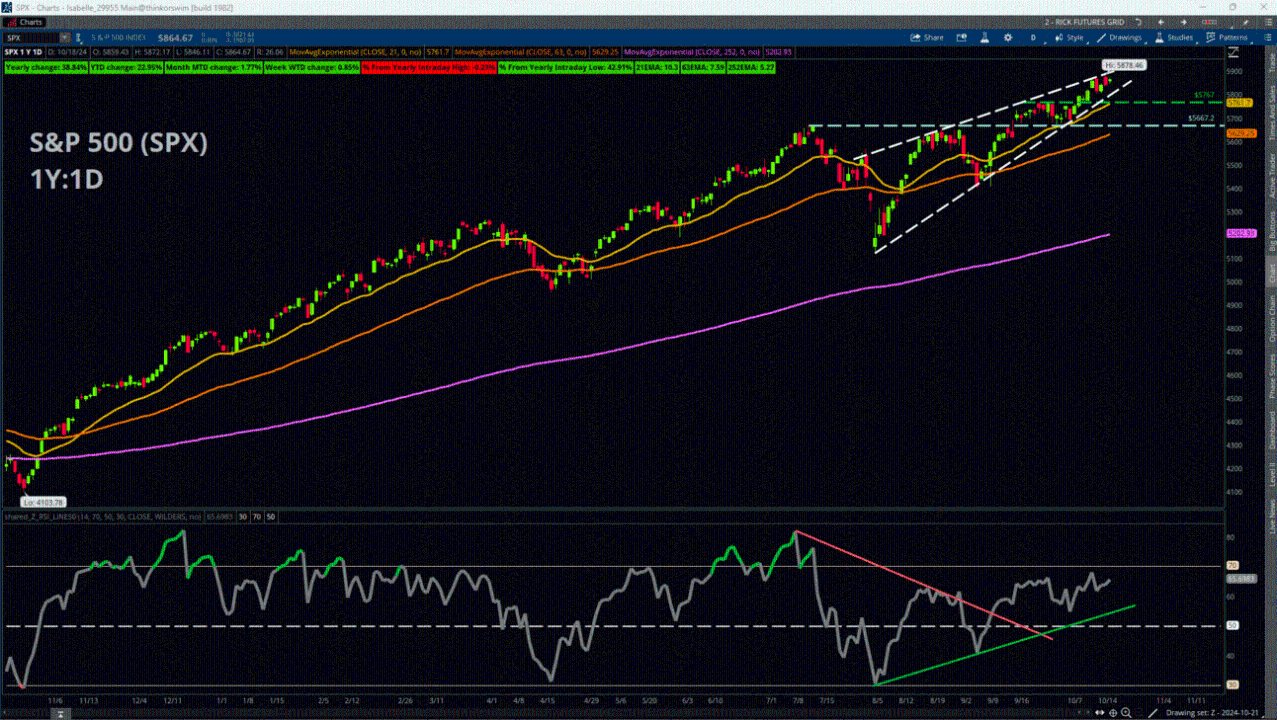
The S&P 500 (SPX) notched another record high of 5,878.46 last week, bringing its total advance during 2024 to about +23% as of Friday’s close. The index’s futures counterpart (/ES) is slightly lower in the premarket as traders gear up for a big earnings week, in which more than 20% of the S&P 500 will give quarterly results.
The SPX has been chugging upward ever since the broader stock market hit a significant low on Aug. 5 and is now up about +14.5% from that point. For now, there are few signs of trend reversal or interruption. Price remains comfortably above most major moving averages, as well as the yearly Linear Regression Line (a line of best fit based on closing prices.) Additionally, the Average Directional Index (ADX), an indicator that measures trend strength, crossed above the 25 mark, which is the threshold for passing from a reading of weak/no trend into what is typically regarded as a strong trend. Meanwhile, a bearish engulfing candle that formed on Tuesday of last week may have given some traders pause, but price did not exhibit any downside follow through the next day which is an important confirmation signal for that type of candle.
One potential problem area is momentum, as the Relative Strength Index (RSI) shows some slight bearish divergence. This means that price made a new closing high on Friday, but the RSI made a lower peak. This mismatch is not necessarily what bulls want to see, as it suggests the pace of the gains is slowing and could be an early warning sign that the trend is starting to lose steam.
For resistance, the obvious mark to overcome is last week’s intraday highs. Beyond that, the situation becomes a bit trickier, as traders have no prior price action to judge potential resistance. One possible study to examine for these purposes is the Linear Regression 50% Channel. The 100% channel represents the distance between the yearly Linear Regression Line and the most extreme price from that point, and the 50% channel is simply half that distance which currently comes in at 6,018.82. For support, a previous set of highs lines up relatively well with the 21-day Exponential Moving Average, so bulls could find a foothold around approximately 5,762 to 5,767. Beyond that, the previous highs from July around 5,667 could be another area to watch.
Featured clips


Charles Schwab and all third parties mentioned are separate and unaffiliated, and are not responsible for one another's policies, services or opinions.


