
Rick Ducat
Chartered Market TechnicianOracle (ORCL) Plunges as Investors Weigh OpenAI Overreliance, Debt Load
Rick Ducat
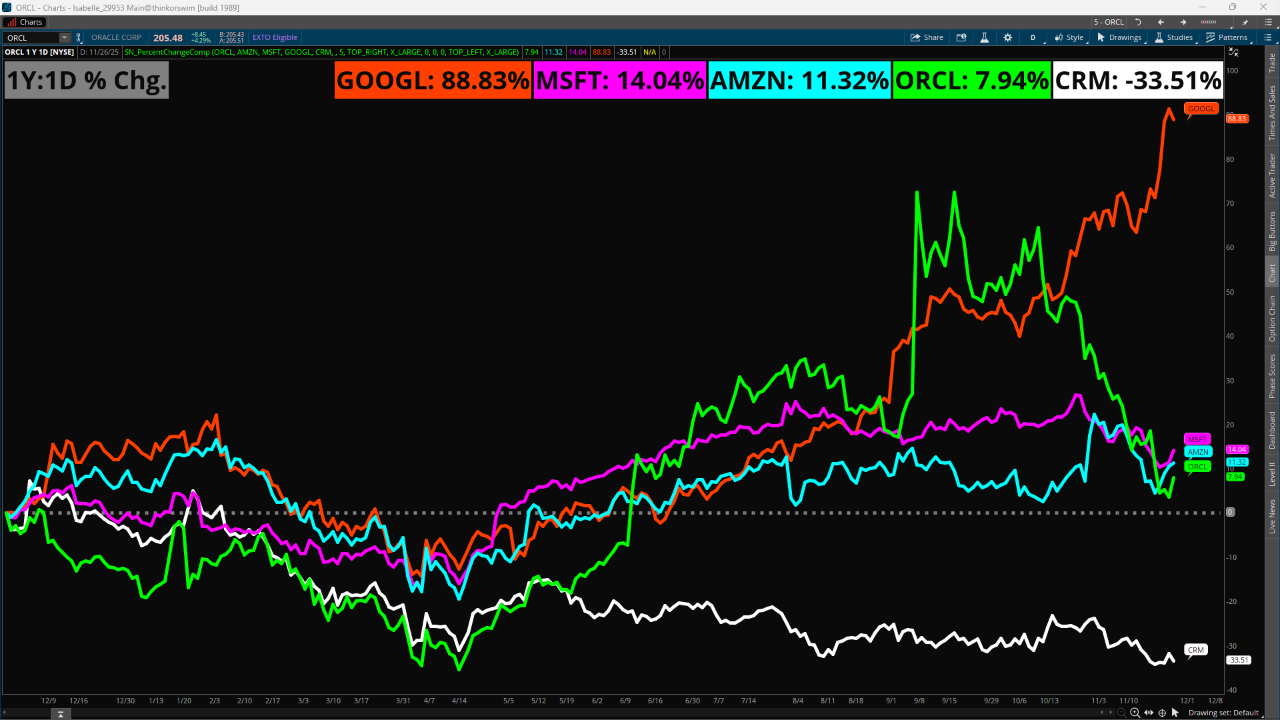
Chartered Market TechnicianOracle (ORCL) was one of the hardest-hit names during the tech sector’s sharp pullback from the dizzying artificial intelligence boom highs, with shares plunging -40% from their all-time highs of 345.72 on Sept. 10 to Tuesday’s close of 197.03.
This swift drop erased all the gains from Sept. 9’s one-day +35.9% earnings rally and then some, with ORCL shares this week testing a notable low point near 189 as investors seem to be wavering about whether the industry’s recent massive A.I. spending spree can generate enough profits to justify itself. Oracle faces rapidly mounting debt, issuing $18B in new bonds in September and bringing its debt load to over $100B as it races to build up the data centers and associated infrastructure necessary for its A.I. transformation.
However, Deutsche Bank on Wednesday seemed to express optimism about the cloud software and hyperscaler company despite the fierce selling, saying the pullback now presents an attractive entry opportunity and reiterating their buy rating and its $375 price target – which would suggest an approximately +82% move to the upside. The note said that Oracle is receiving too little credit for its $300B business agreements with OpenAI, suggesting that the deal’s “very real opportunity” is enough to counterbalance the potential risks.
Not everyone on the Street is as enamored of the partnership, with DA Davidson expressing a dimmer perspective as they slashed their price target to $200 from $300 and kept their neutral rating on Nov. 25. In stark contrast to the Deutsche Bank note, DA Davidson expressed concern that Oracle’s remaining performance obligations rely too heavily on the OpenAI deal.
Investors likely will be looking for new insights about these issues when Oracle reports earnings on Dec. 8, with the options market showing a potential expected move of about +/-13.2% for the Dec. 12 expiration. From a technical perspective, price saw an upside breakout from a downward-sloping trendline that began with highs from Oct. 16 that also corresponded with the RSI breaking its own downward trendline and moving out of the oversold area. One upside point to watch is near 234, as it represents not only intraday relative highs from Nov. 20 but also the Point of Control (price area with heaviest trading activity) on the yearly Volume Profile Study.
Featured Clips
Andersen: Starting to See ‘Initial Cracks’ for NVDA, Market has ‘Fantasy’ of AI Capabilities
Morning Trade Live
► Play video
