
Kevin Green
Sr. Markets CorrespondentPossible Bearish Divergence in Nasdaq-100 (NDX) Chart
Kevin Green
Sr. Markets CorrespondentThe market continues to digest deterioration on the economic front, and some of the steam is coming out of the AI trade as memory, and neocloud stocks pull back considerably from their recent highs.
Beneath that weakness, a technical pattern may be unfolding, and it is most visible on the monthly charts. In particular, the Nasdaq-100 (NDX) may trigger a bearish monthly signal by the end of October, one that has preceded larger declines in the past.
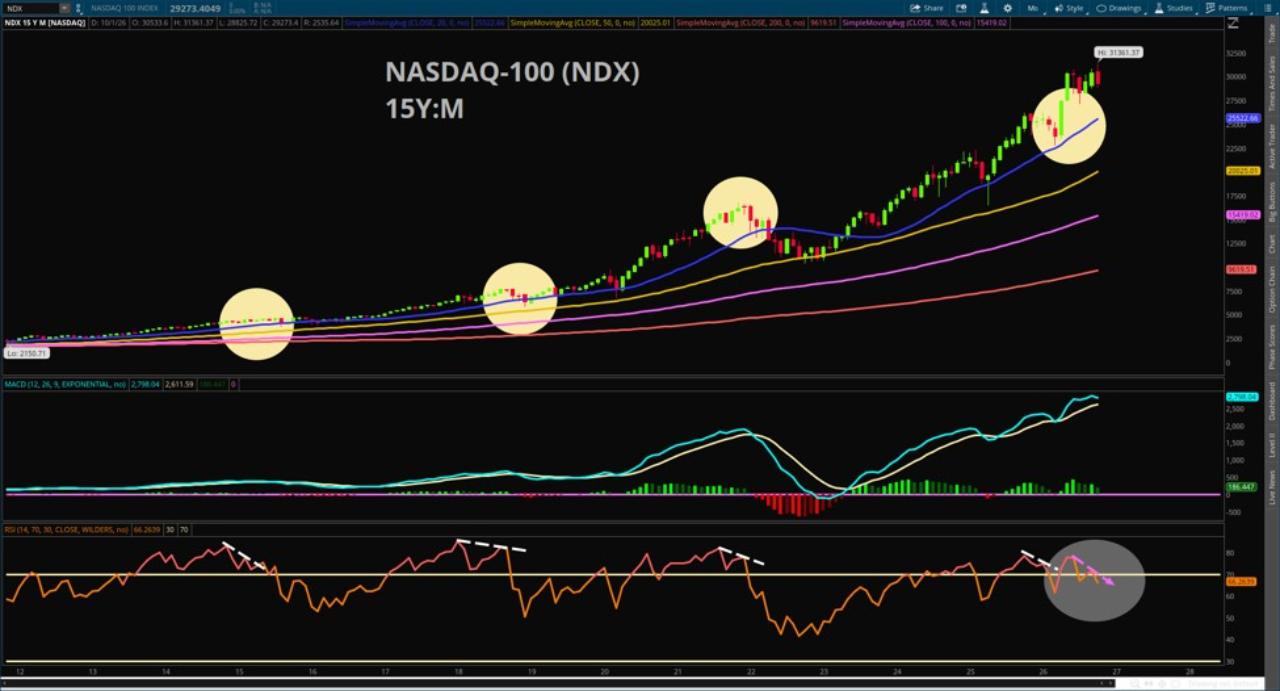
Price momentum has clearly stalled, and tech stocks have pulled back for a multitude of reasons. Now that weakness may be confirmed technically. On the 15-year monthly candlestick chart, a bearish divergence is forming on the Relative Strength Index (RSI), and unless the NDX makes an aggressive push higher in the four trading sessions left in the month, including today, October 27, that divergence will be confirmed.
What the Relative Strength Index May Be Saying
The RSI is a momentum oscillator that measures both the speed and magnitude of a price trend. When an asset rallies, the RSI rises with it, and the faster the move, the steeper the oscillator’s climb. The reverse holds true when prices fall. When price stalls or consolidates, the RSI flattens, signaling fading momentum and a lack of direction. A bearish divergence occurs when the RSI makes a lower high, a sign that momentum is waning, and that a change in price direction may be approaching.
That matters because, historically, lower highs in the monthly RSI have tended to coincide with pullbacks of at least 8–10% in the months that followed. The chart highlights these past instances, each followed by a decline to at least the 20-month simple moving average. A pullback came at the beginning of this year. In January 2022, a completed lower high in the RSI coincided with a drop of more than 20% in the Nasdaq-100, and September 2018, produced a similar setup and pullback.
What Happens When Moving Average Stalls?
Adding to the case, the Moving Average Convergence Divergence (MACD) is also flashing a potential stall and even a stage 1 bearish cross, with the 12-period exponential moving average (EMA) in blue crossing below the 26-period EMA in yellow.
None of this is a definitive call on the market’s direction, as fundamentals can change. The midterm election outcome is unknown. Geopolitical tensions in the Middle East may ease and reduce inflation risk. Concerns around AI financing may fade, or a new technology may give investors enthusiasm for an emerging trend. From a technical standpoint, however, the market is stalling, and without a quick shift in sentiment, similar setups in the past suggest the path of least resistance may be lower.
Featured Clips
Anthropic Secures $63B AVGO Chip Deal, NVDA Invests in META Stock Offering
Morning Movers
► Play videoAnthropic's Valuation Gap: Addressing Sales Runway, GOOGL & AMZN Concentration Fears
Market On Close
► Play video