
Rick Ducat
Chartered Market TechnicianSalesforce (CRM) Earnings Preview: Price Grinding Lower Amid Broader Software Slump
Rick Ducat
Chartered Market TechnicianSalesforce (CRM) reports earnings after the closing bell on Wednesday, Dec. 3 as one of the headline names kicking off the final trading month of 2025, as the broader software sector continues to face a challenging environment that is being significantly disrupted by artificial intelligence.
Estimates for EPS are for $2.85 vs. $2.41 last year (+18.2%) and for revenue of $10.26B against $9.44B year-over-year (+8.6%), according to Zacks. The options market for the Dec. 5 expiration that captures earnings shows an expected move with a range of about 213 to 251 (+/- 8.3%).
The software sector has struggled this year, with Salesforce and its competitors like Workday (WDAY), Adobe (ADBE), and ServiceNow (NOW) all significantly underperforming the tech sector. Even though these earnings estimates for Salesforce suggest notable growth, guidance seems like it could be a critical factor for the beleaguered relationship management software company.
One only needs to look toward its rival Workday (WDAY), which suffered a -7.8% plunge despite solidly beating on the top and bottom lines in its own earnings report last week. The fly in the ointment seems to be that guidance was not significantly raised and management did not deliver its usual forward look toward next year’s margins, which unleashed a flurry of analyst price target cuts showing a general theme of concern over organic growth prospects. Salesforce itself faced a price cut from Citigroup last week, with the firm lowering its target to $253 from $276 and keeping its neutral rating.
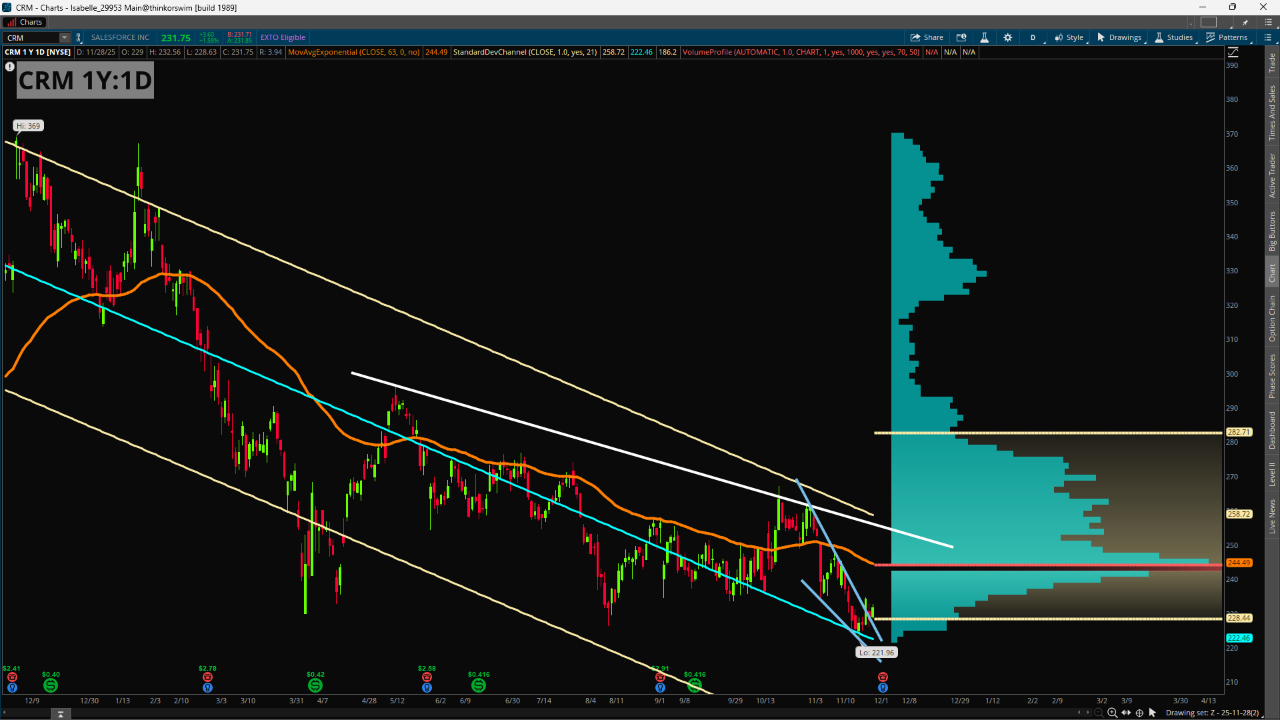
Salesforce shares hit fresh 52-week lows just below 222 on Nov. 21 with only a tepid bounce of about +5% since then, bringing the total decline from the all-time highs of 369 to about -37%. Price has broken beyond the boundaries of a shorter-term falling wedge-type shape but has not seen any strong upside push ahead of earnings.
Areas to watch include the yearly Volume Profile Point of Control centered around the 244 level, which is the heaviest trading area and thus represents a potential resistance. This area also presently lines up with the 63-day Exponential Moving Average giving traders a confluence to consider. To the downside, the yearly Linear Regression Line, which typically is viewed as a notion of fair value, is very close to the yearly lows near 222, so traders likely will be eyeing this as a potential breakdown point.
Featured Clips
Bohen: 2026 A.I. Trade to 'Make 2025 Look Like a Joke,' GOOGL Favorite
Opening Bell With Nicole Petallides
► Play video
