
Rick Ducat
Chartered Market TechnicianS&P 500 Near Highs; Can Bulls Muster a Breakout before Year’s End?
Rick Ducat
Chartered Market TechnicianIt’s been a tumultuous trading year as the artificial intelligence boom threw markets into upheaval with stark winners and losers from this potentially revolutionary technology. The SPDR S&P 500 ETF (SPY) is up a bit below 18% year-to-date in 2025, with price tantalizingly close to breaking out above new highs as investors ponder whether some last-minute Santa Claus rally magic could propel the frenzied A.I. market into new highs.
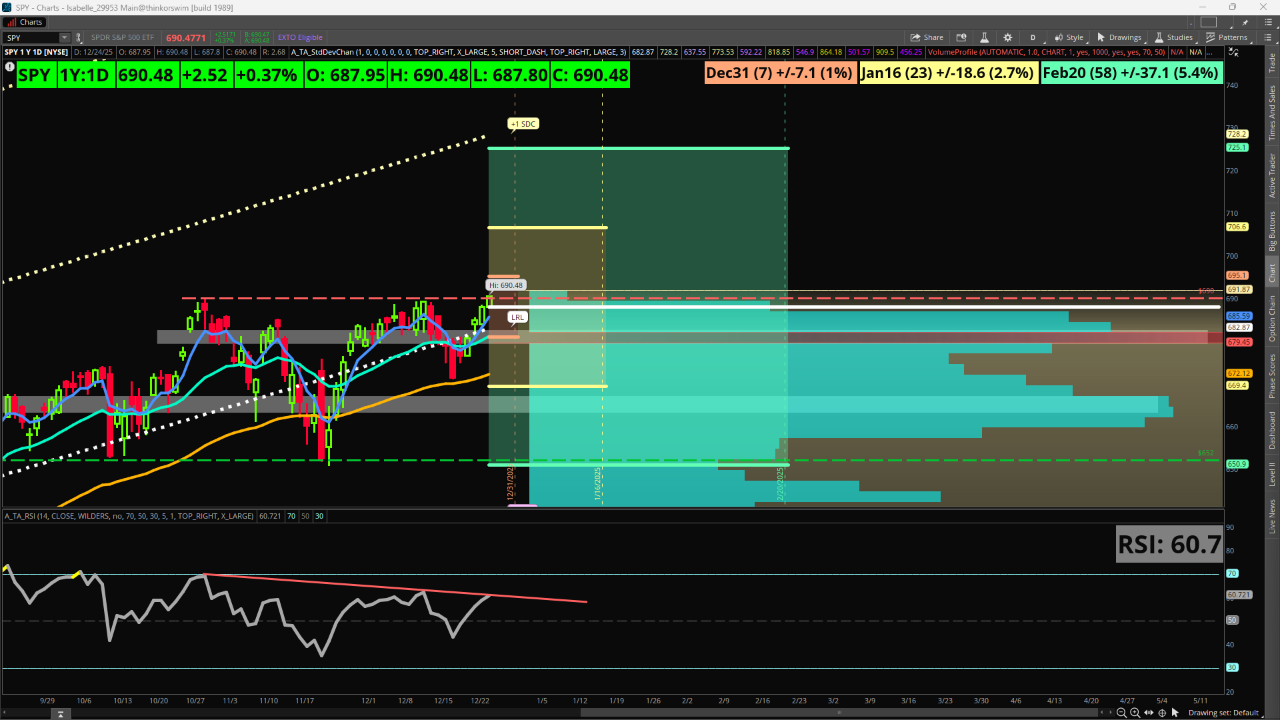
Price activity for the SPY has been rangebound in recent months, with notable lows forming near 652 and similar highs near 690. Trading activity yesterday hit new intraday all-time highs and pushed above some notable areas. First, price broke above a large volume node near the 680 level (which became the Point of Control, the area of heaviest trading, during Wednesday’s session) according to the yearly Volume Profile study, which is rivaled in size only by a similar node 661. Second, price also recently broke above the 5-day (weekly) and 21-day (monthly) exponential moving averages in quick succession.
One potential fly in the ointment is the Relative Strength Index (RSI), which measures momentum. This indicator shows bearish divergence, meaning the RSI is making lower highs while price is making higher closes simultaneously – a mismatch that suggests the pace of the gains is slowing. Watch for a close above the 690 resistance and for the RSI to break above a downward sloping trendline starting from late October.
The options market shows a potential expected move of around +/-1% for the quarterly options expiring on Dec. 31. Meanwhile, the Jan. 16 and Feb. 20 monthly contracts show potential moves of 2.7% and 5.4%, respectively. The lower edge of the February move lines up closely with old support near the 652 level, so this could be a key area in the coming weeks.
Featured Clips