
Kevin Green
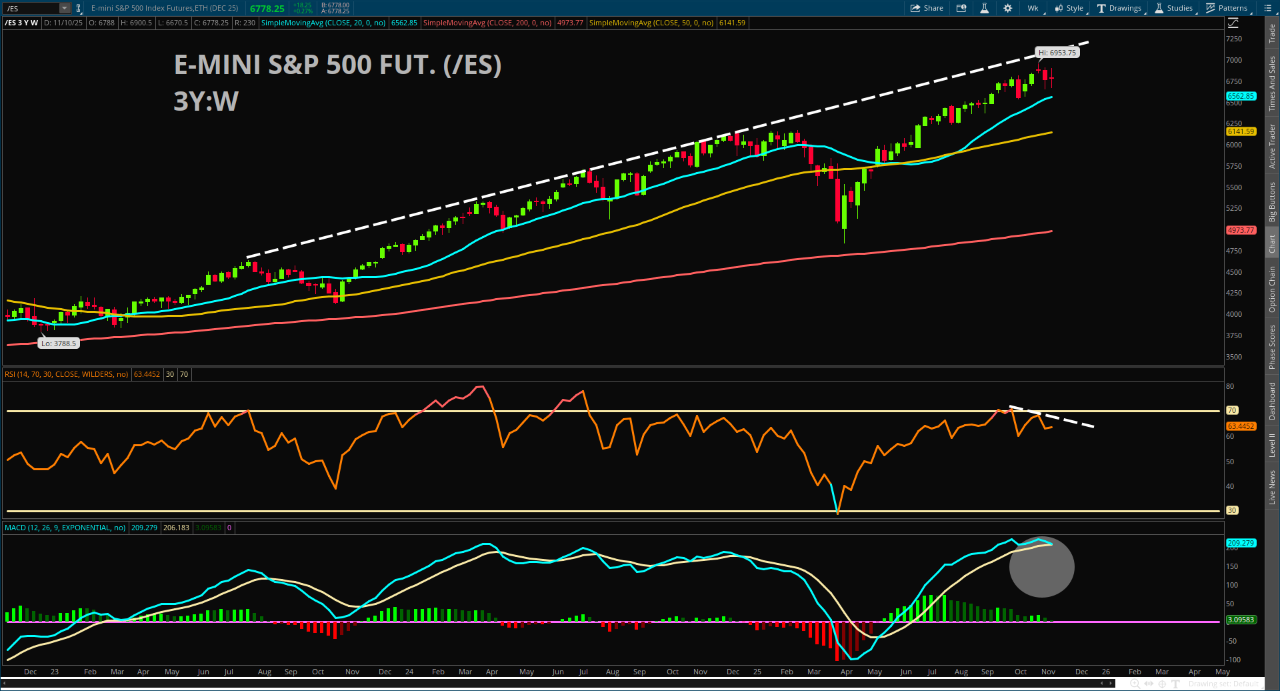
Sr. Markets CorrespondentS&P 500 Weekly Chart Shows Bearish Setup
Kevin Green
Sr. Markets CorrespondentThe market experienced its second consecutive week of heightened volatility as a multitude of factors continue to weigh on investors’ minds, even with the S&P 500 still within 3% of all-time highs. Concerns range from the sustainability of A.I.-related debt issuance, and its impact on near-term cash flow for several megacap names, to debates over the proper depreciation timeline for GPUs, or their “useful life.” Early in the week, the market rallied on news of the U.S. government shutdown ending, which should relieve pressure on industries and geographic regions already affected. Friday’s rebound in equities was also impressive. Unfortunately, from a technical standpoint, the index now sits at a dilemma heading into next week.
Leveraging the E-Mini S&P 500 futures chart, the index managed to trade back toward and recover near the 50-day simple moving average—a key support level over the last six months. As of Friday’s close, that support remains intact on the daily timeframe. However, the breakdown below the 20-day SMA is still a notable concern for technicians, and the fact that the Relative Strength Index (RSI) continues to make lower lows and lower highs suggests that the market is consolidating in time rather than in price. When we zoom out to the weekly chart of the E-Mini S&P 500, the setup becomes concerning and may signal that a deeper pullback could be forming over the next several weeks.
Two indicators stand out on the weekly timeframe. The first is the weekly RSI, which has now completed a confirmed lower-high sequence even as price advanced over the last two months. This loss of momentum, known as a bearish divergence, may currently be in the early stages of resolving, but history shows that when such divergences occur, S&P 500 futures typically retest a key weekly moving average, either the 20-week or 50-week SMA, before resuming higher. The 20-week SMA is currently sitting near 6560. The second concern is the MACD (Moving Average Convergence/Divergence), which measures trend strength by comparing the 12-week exponential moving average to the 26-week EMA. A bearish cross occurs when the 12-week EMA moves below the 26-week EMA, and that signal is only a few points away from triggering.
The combination of a developing bearish divergence and an impending MACD bear cross may prompt caution among technical traders. This is why the coming week will be particularly interesting. Friday’s intraday strength—marked by a strong bounce off the lows and the reclaiming of several key structural levels—could lead to early-week follow-through. However, the longer-term timeframe continues to signal caution, at least for now.
Featured Clips
Applied Materials (AMAT) Stock Fell After Earnings, But Are There Bullish Signals?
Trading 360
► Play video
