
Kevin Green
Sr. Markets CorrespondentAre Oil Prices and Energy Markets Poised for a Sharp Pullback?
Kevin Green
Sr. Markets CorrespondentOil and petroleum markets have been operating in an unusual environment where global refining capacity remains tight, and Middle East logistical hurdles continue to disrupt supplies of medium and heavy sour crude.
But has the market started to adapt, pricing in these conditions as the new normal? The stalemate between Iran and the U.S. drags on, with kinetic actions on both sides but enough hope to suggest a deal may be in the works.
Technical indicators are forming more bearish patterns. Add in the U.S. seasonal decline in winter demand and a Super El Niño that could reduce the risk of widespread freeze-related shut-ins, and energy markets are shaping up for an interesting couple of months.
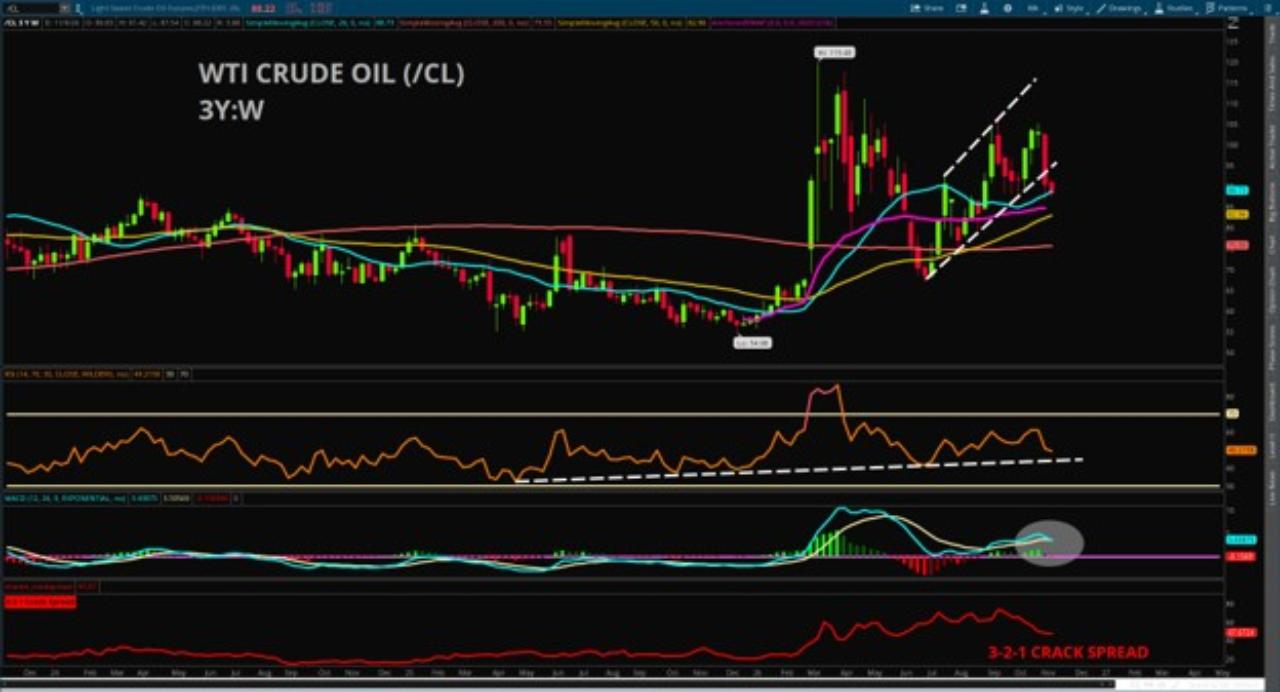
On a three-year weekly chart, the U.S. oil benchmark, WTI, has been forming a flag pattern. Over the last five months, it has also put in a double top, with the $105 level acting as firm resistance. Last week, WTI fell 12%, failing to get back inside the ascending channel that has held since July.
The weekly Moving Average Convergence/Divergence (MACD) adds to the bearish case. Last week it posted a bearish crossover, with the 12-week Exponential Moving Average (EMA) crossing below the 26-week EMA, a sign that near-term price momentum has turned bearish. The Relative Strength Index (RSI) is still making higher lows, but it is now close to testing the uptrend line that has held for almost two years.
Finally, the 3-2-1 crack spread has been moving lower. This spread measures the profitability of refining three barrels of crude into two barrels of gasoline and one barrel of diesel or heating oil. Its decline shows that gasoline and diesel futures prices are falling faster than input crudes - WTI or Brent, the international benchmark. On the downside, the key level of support for WTI is the 200-week Simple Moving Average (SMA), currently at $75.55.
All in all, the bulls appear to be running out of steam, with key channels and moving averages under pressure. Headlines can still move prices sharply, especially if energy infrastructure in the Middle East keeps being targeted or disrupted. But if the current stalemate simply holds, markets may come to price this environment as the new normal.
Also see:
Featured Clips
NVDA Jensen Huang Probe Hits Stock; AMD Upgrade & SPCX Starship Launch Date
Morning Movers
► Play video