Market Minute: Broadcom Earnings After Today’s Close as Semiconductor Sector in Focus
Broadcom (AVGO) reports earnings in today’s postmarket session after shares gapped up yesterday on reports that it is working on an artificial intelligence computer chip with Apple (AAPL). While Broadcom is perhaps not a common household name, the semiconductor company is #10 in terms of market cap in the S&P 500 and has seen strong performance during the past year to the tune of about +70% off its 52-week lows near 95.61. It is also has the 9th largest market cap in the Nasdaq-100 (NDX) and typically shows very tight correlation with the tech sector, so this earnings event could have important effects on the broader market.
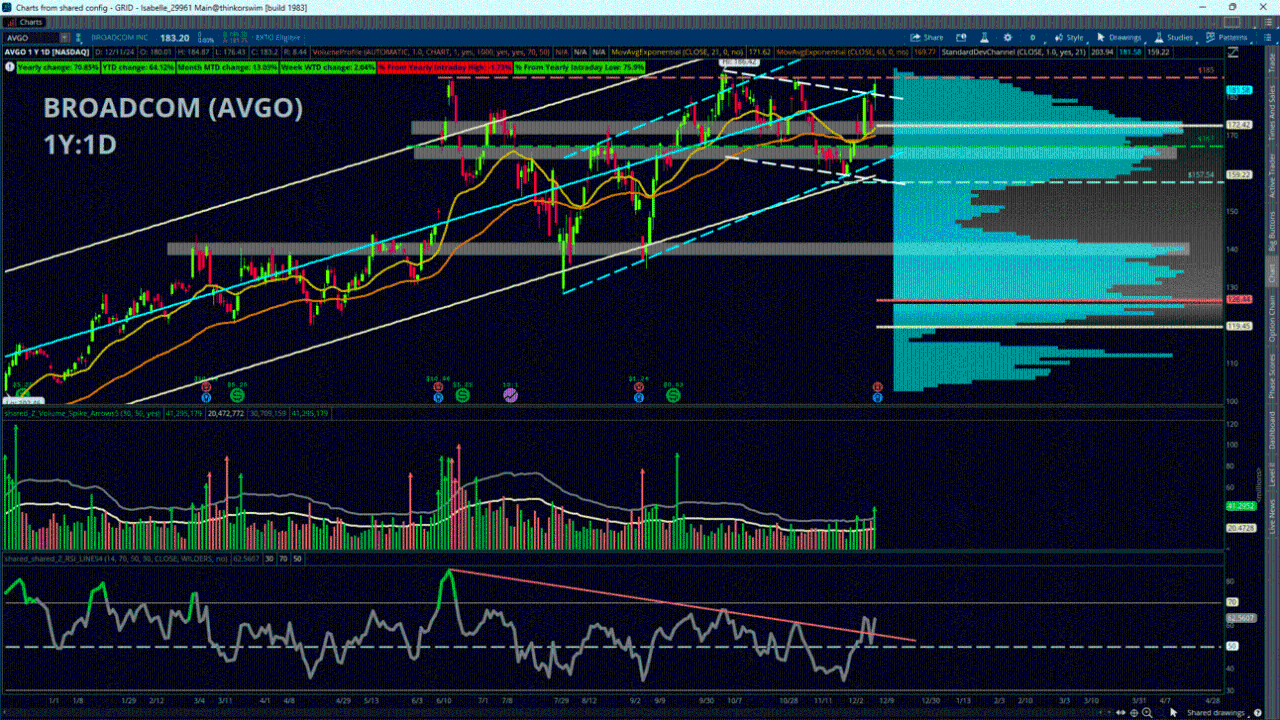
Bulls have enjoyed a strong run this year, but price action gives a somewhat mixed read. By one measure, price still shows an upward trendline starting with the Aug. 5 lows, but price also has made a series of lower highs since then. A key point to consider as well is that price stalled out near 185 in November after making several tests of this area since June, so it now provides a clear and noteworthy resistance area to consider. More recently, price seemed to make an important breakout above the 167 area on Dec. 4 on heavy volume, a level that lines up with heavy trading volume according to the yearly Volume Profile study and has often been a source of both support and resistance. Additionally, price crossed above the 21-day and 63-day Exponential Moving Averages, which were closely clustered together, and held them after retesting support in the following days. However, shares are now stuck near another resistance confluence in the yearly Linear Regression Line (line of best fit based on closing prices) and a downward trendline beginning with the all-time highs and connecting the subsequent highs from November.
Upside resistance is fairly obvious: the persistent ceiling near 185 and the intraday all-time highs of 186.42 are the points to beat. From there, the yearly +1 Standard Deviation Channel currently comes in near 204 and could be another area to watch. To the downside, look for the aforementioned confluence of the 21-EMA and 63-EMA and the horizontal support level between about 167 to 171. After that, another potentially supportive area is the -1 Standard Deviation Channel, which roughly lines up with the trendline starting at Aug. 5 and the recent lows near about 158 to 159.
Featured clips


Charles Schwab and all third parties mentioned are separate and unaffiliated, and are not responsible for one another's policies, services or opinions.


