Market Minute: Crude Oil Suffers Breakdown Through Support
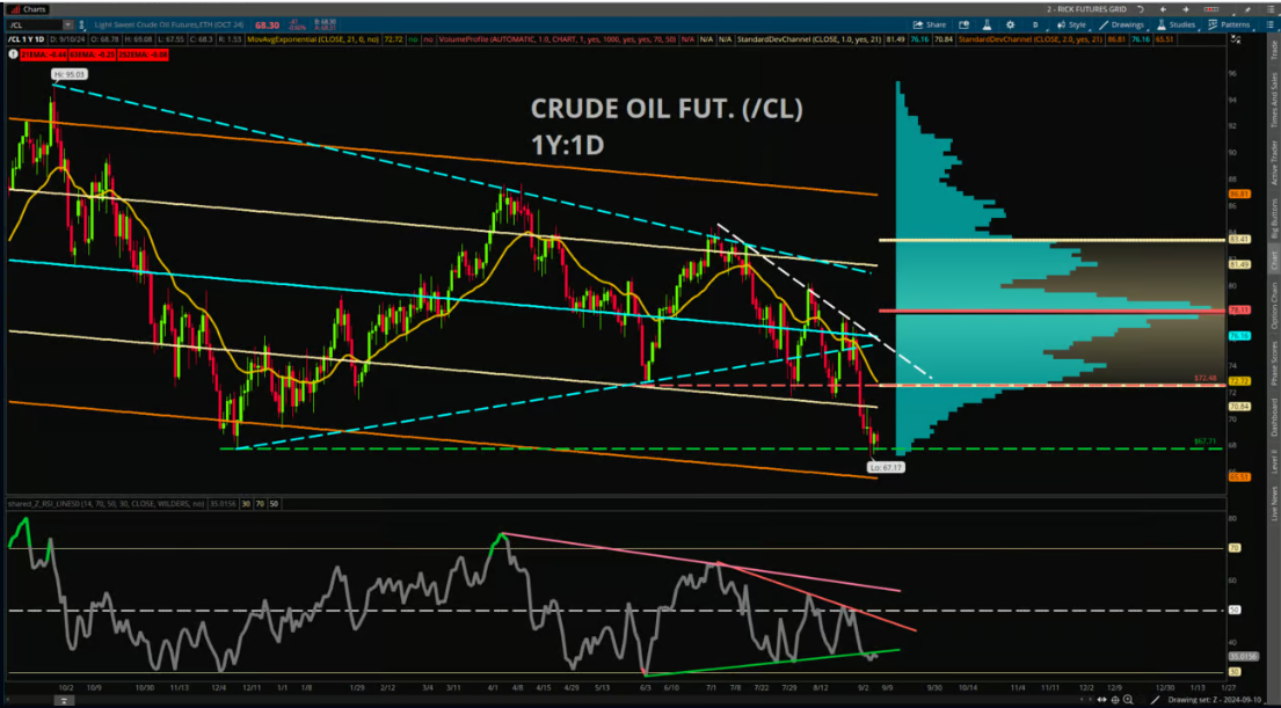
Crude oil futures (/CL) have seen a notable drop in recent weeks, plunging about -11.3% from the high point of 77.60 on Aug. 26 to yesterday’s close of 68.80 and making new 52-week lows along the way. Additionally, last week’s -7.45% weekly decline made for the /CL contract’s worst week since October 2023, and softer premarket trading is showing the potential for further weakness today.
Crude oil had been in a longer-term triangular pattern for much of the past year, with a downward trendline beginning with the 52-week highs of 95.03 on Sept. 28 and an upward trendline beginning with the low point of 67.71 on Dec. 13. However, some cracks started to show in early August, as price broke through this triangular pattern to the downside. Price continued in a zig-zag type pattern, rallying and then declining and rallying and then declining once again – but each time, price marked a lower high and a lower low.
Now, traders face a situation with price having broken below most major moving averages and charts showing other signs of technical deterioration. The Relative Strength Index (RSI) shows weakening momentum, as this indicator is not only below the 50-midline that separates bullish and bearish momentum but also recently made new relative lows. Technicians also may have noted that another indicator that measures trend strength, the Average Directional Index (ADX), continues to rise after reaching a trough on Aug. 30 which suggests the downtrend is increasing in severity.
At this point, oil traders may be more concerned about further downside given the recent weakness and there is little in the way of recent price action to serve as a guidepost. The area near 67 could be a supportive point to watch, as this was around where price bottomed out multiple times from late May to June in 2023. Additionally, traders could consider the yearly -2 Standard Deviation Channel, which represents two standard deviations below the yearly Linear Regression Line and comes in near 65.50. To the upside, the -1 Standard Deviation Channel in turn could be an area of resistance near 70.83. Beyond that, the old lows near 71.50. could be another point to watch.
Featured clips


Charles Schwab and all third parties mentioned are separate and unaffiliated, and are not responsible for one another's policies, services or opinions.


